Matplotlib and Plotly charts
We are thrilled to introduce Matplotlib and Plotly charting controls in Flet 0.1.63!
Matplotlib and Plotly are the most recognized Python charting libraries with a ton of features. They are greatly compatible with other scientific Python libraries such as Numpy or Pandas.
No doubt, it would be nearly impossible to replicate their functionality as pure Flutter widgets. Fortunately, both Matplotlib and Plotly can export charts into various formats, such as SVG. On the other hand Flet can display SVG images and that gives a perfect combination - Flet charting controls for Matplotlib and Plotly!
The resulting solution works so great that it's possible to display almost any example from Matplotlib and Plotly galleries - your imagination is the only limit!
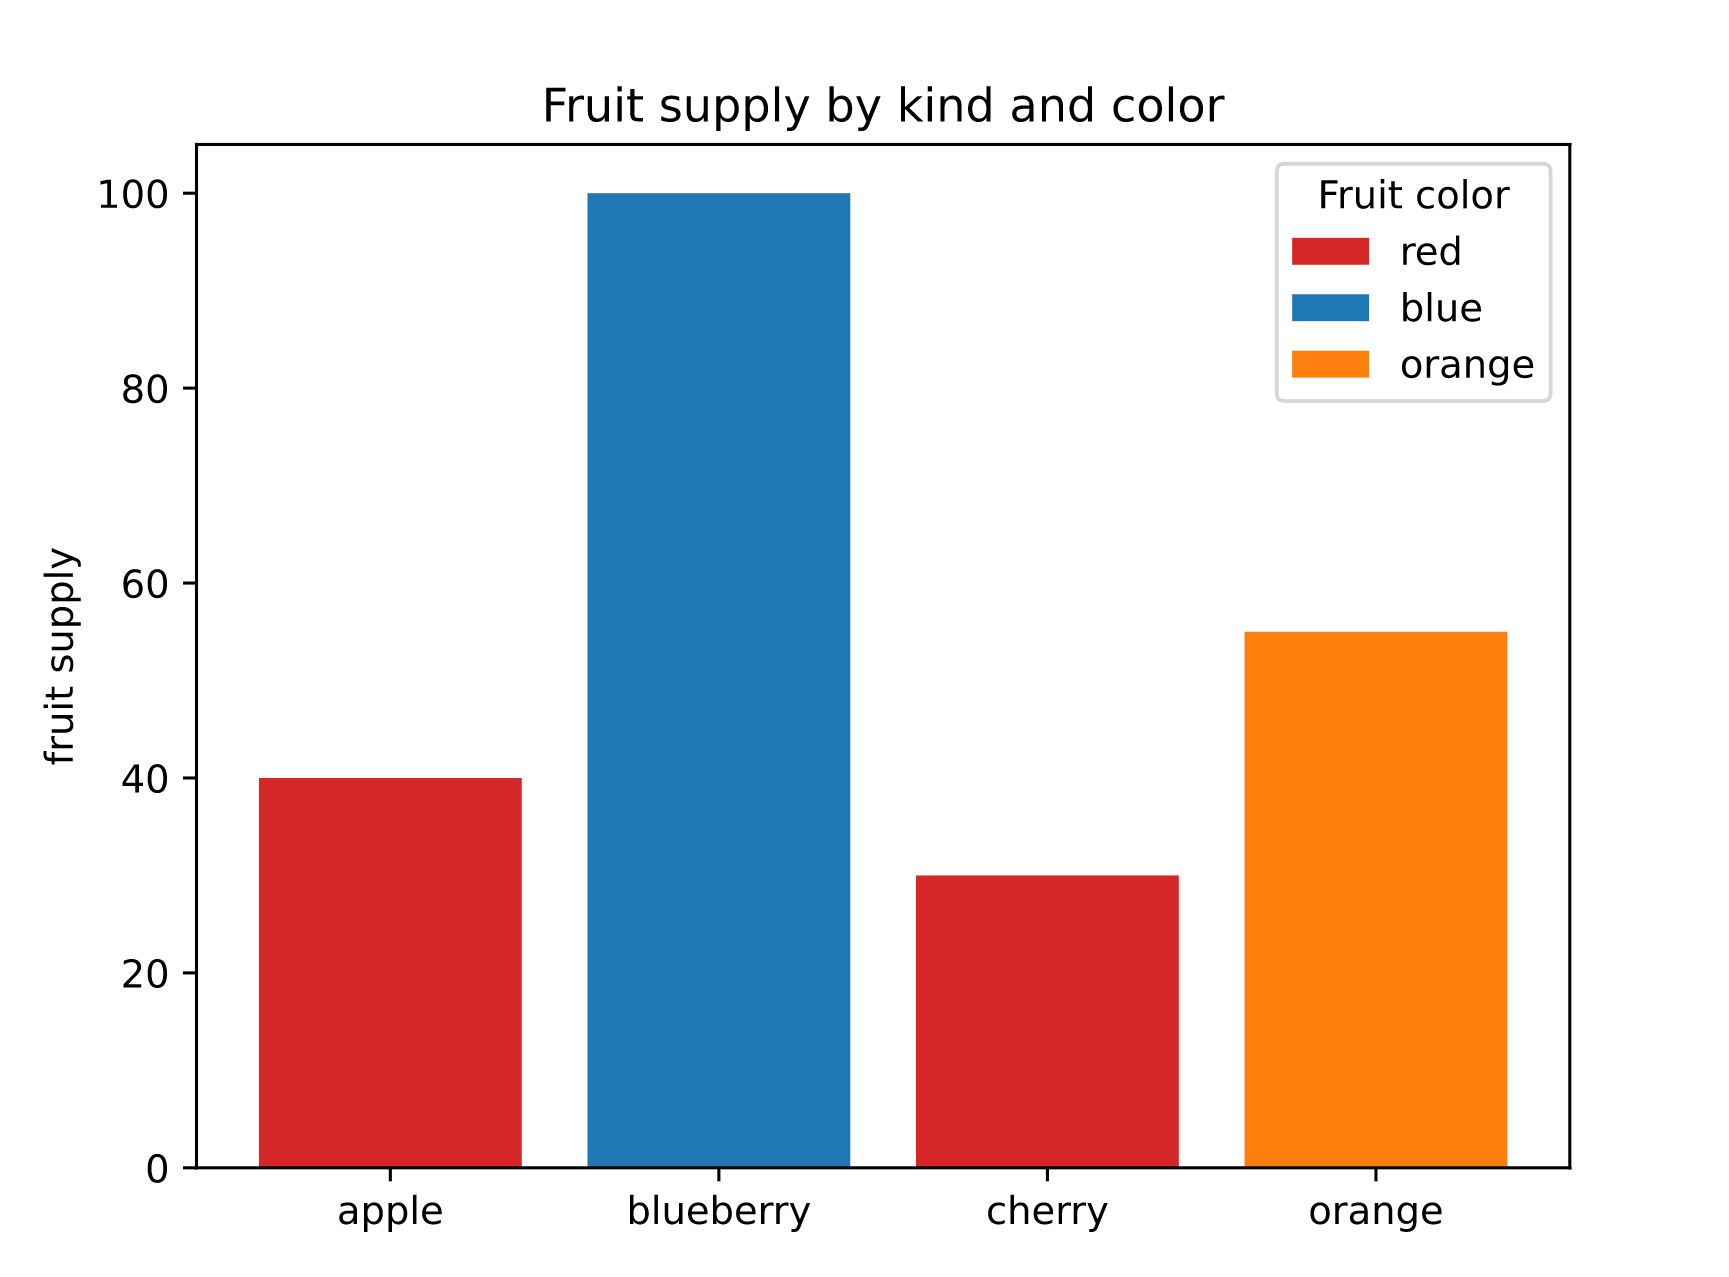
Plot a simple bar chart:

a nice scatter with legend:

or some multi-chart contour plot:

Check the docs for Matplotlib and Plotly charting controls:
Explore Flet chart examples.
Learn Python libraries by examples:
In the future releases, we may add an interactive "toolbar" for Matplotlib charts by implementing a custom backend. Or maybe it's a great excersize for Flet users? 😉
Also, when it's time for Flet to support other languages we would need to re-visit charting to make it language-agnostic as the current charting implementation relies on Python libraries.
Upgrade Flet module to the latest version (pip install flet --upgrade), integrate auth in your app and let us know what you think!
Enjoy!