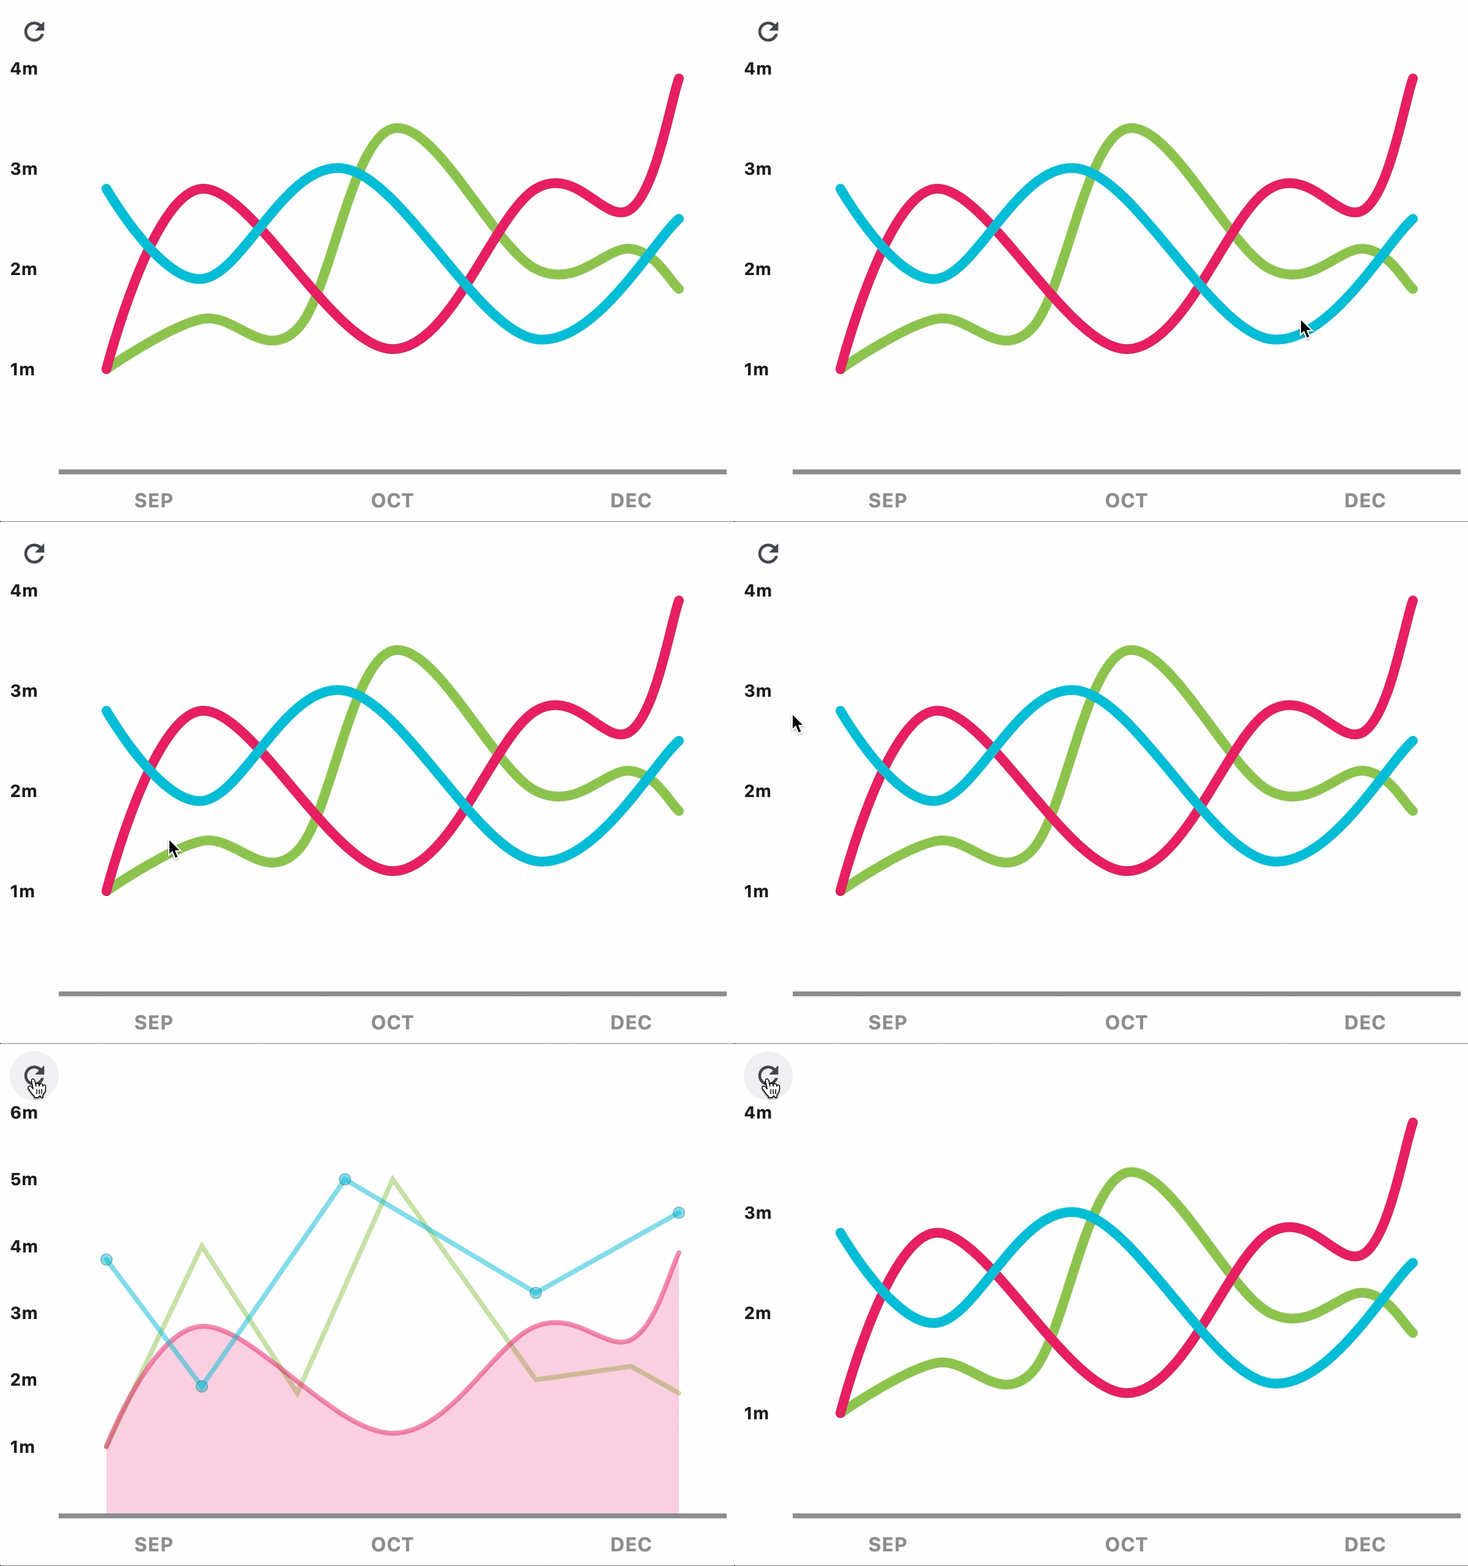
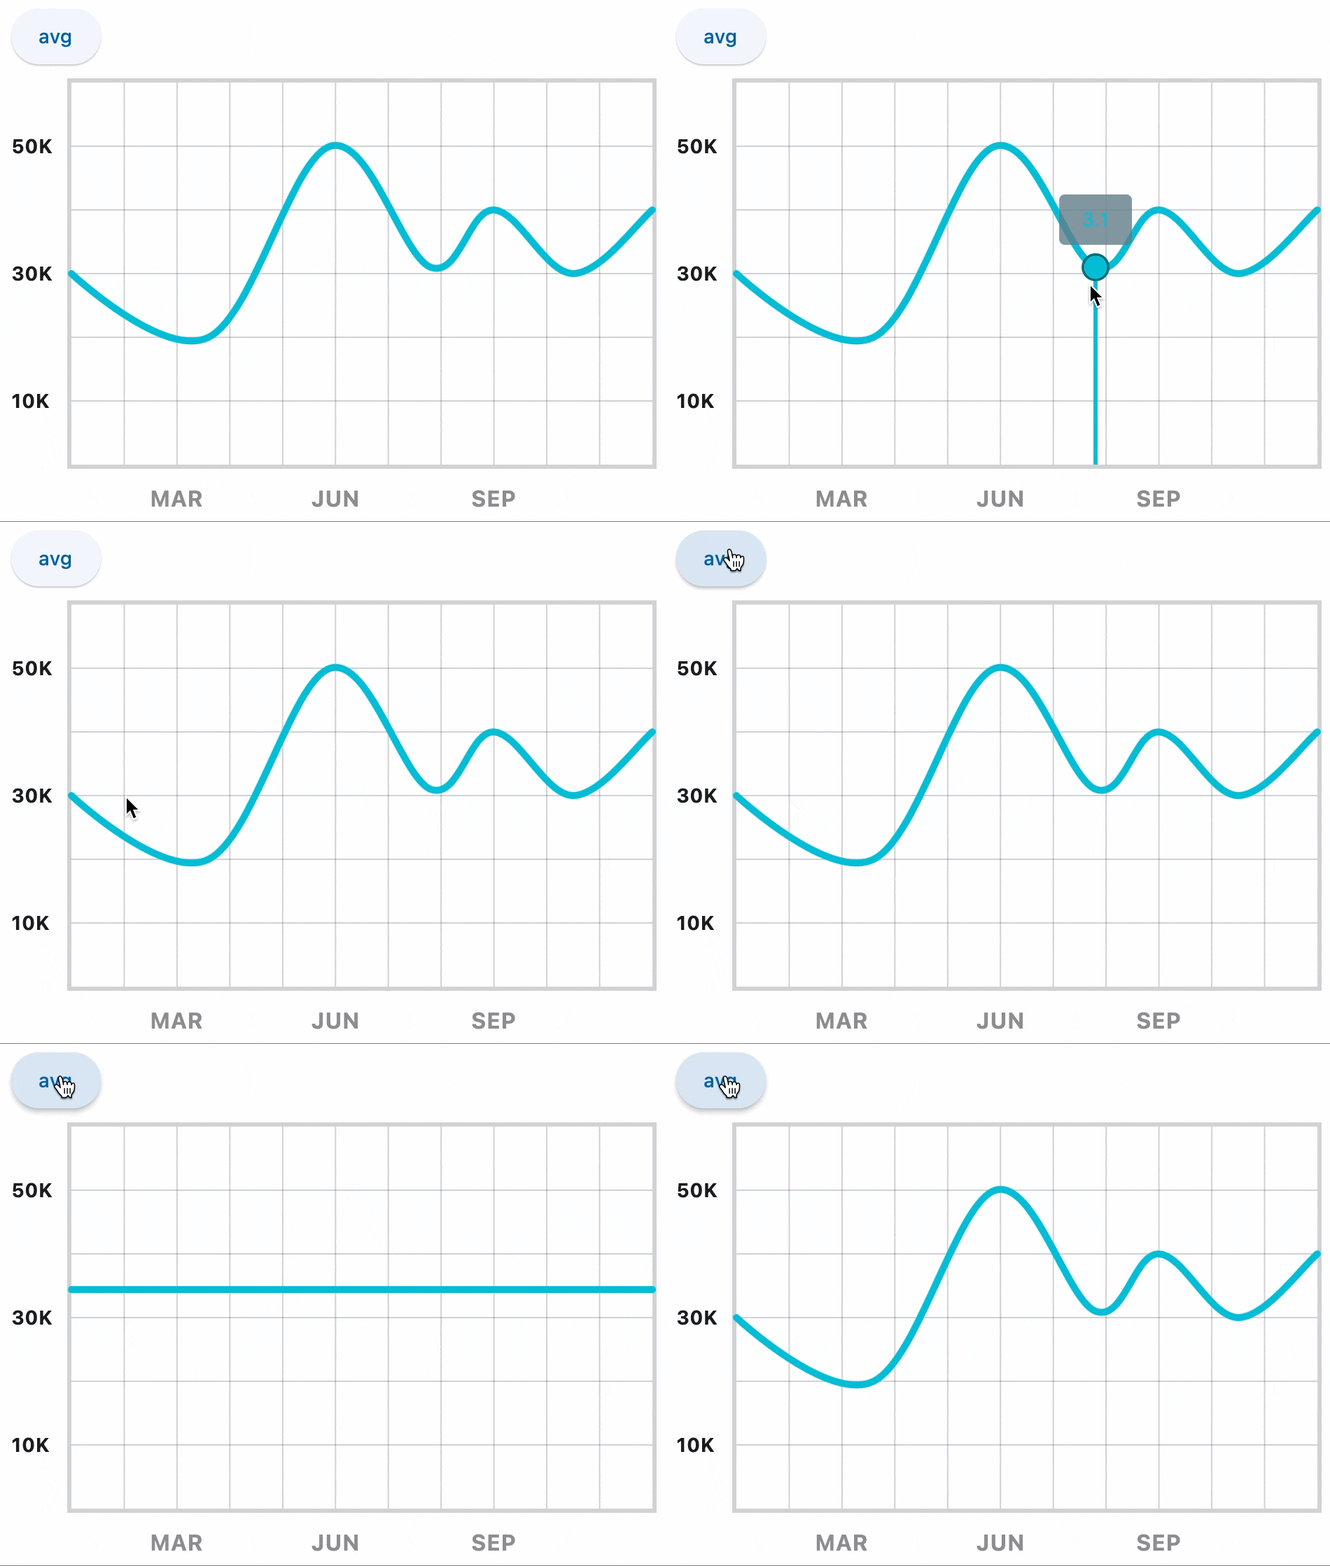
LineChart
Draws a line chart.
Examples
LineChart 1

import flet as ft

class State:
    toggle = True

s = State()

def main(page: ft.Page):
    data_1 = [
        ft.LineChartData(
            data_points=[
                ft.LineChartDataPoint(1, 1),
                ft.LineChartDataPoint(3, 1.5),
                ft.LineChartDataPoint(5, 1.4),
                ft.LineChartDataPoint(7, 3.4),
                ft.LineChartDataPoint(10, 2),
                ft.LineChartDataPoint(12, 2.2),
                ft.LineChartDataPoint(13, 1.8),
            ],
            stroke_width=8,
            color=ft.colors.LIGHT_GREEN,
            curved=True,
            stroke_cap_round=True,
        ),
        ft.LineChartData(
            data_points=[
                ft.LineChartDataPoint(1, 1),
                ft.LineChartDataPoint(3, 2.8),
                ft.LineChartDataPoint(7, 1.2),
                ft.LineChartDataPoint(10, 2.8),
                ft.LineChartDataPoint(12, 2.6),
                ft.LineChartDataPoint(13, 3.9),
            ],
            color=ft.colors.PINK,
            below_line_bgcolor=ft.colors.with_opacity(0, ft.colors.PINK),
            stroke_width=8,
            curved=True,
            stroke_cap_round=True,
        ),
        ft.LineChartData(
            data_points=[
                ft.LineChartDataPoint(1, 2.8),
                ft.LineChartDataPoint(3, 1.9),
                ft.LineChartDataPoint(6, 3),
                ft.LineChartDataPoint(10, 1.3),
                ft.LineChartDataPoint(13, 2.5),
            ],
            color=ft.colors.CYAN,
            stroke_width=8,
            curved=True,
            stroke_cap_round=True,
        ),
    ]

    data_2 = [
        ft.LineChartData(
            data_points=[
                ft.LineChartDataPoint(1, 1),
                ft.LineChartDataPoint(3, 4),
                ft.LineChartDataPoint(5, 1.8),
                ft.LineChartDataPoint(7, 5),
                ft.LineChartDataPoint(10, 2),
                ft.LineChartDataPoint(12, 2.2),
                ft.LineChartDataPoint(13, 1.8),
            ],
            stroke_width=4,
            color=ft.colors.with_opacity(0.5, ft.colors.LIGHT_GREEN),
            stroke_cap_round=True,
        ),
        ft.LineChartData(
            data_points=[
                ft.LineChartDataPoint(1, 1),
                ft.LineChartDataPoint(3, 2.8),
                ft.LineChartDataPoint(7, 1.2),
                ft.LineChartDataPoint(10, 2.8),
                ft.LineChartDataPoint(12, 2.6),
                ft.LineChartDataPoint(13, 3.9),
            ],
            color=ft.colors.with_opacity(0.5, ft.colors.PINK),
            below_line_bgcolor=ft.colors.with_opacity(0.2, ft.colors.PINK),
            stroke_width=4,
            curved=True,
            stroke_cap_round=True,
        ),
        ft.LineChartData(
            data_points=[
                ft.LineChartDataPoint(1, 3.8),
                ft.LineChartDataPoint(3, 1.9),
                ft.LineChartDataPoint(6, 5),
                ft.LineChartDataPoint(10, 3.3),
                ft.LineChartDataPoint(13, 4.5),
            ],
            color=ft.colors.with_opacity(0.5, ft.colors.CYAN),
            stroke_width=4,
            stroke_cap_round=True,
        ),
    ]

    chart = ft.LineChart(
        data_series=data_1,
        border=ft.Border(
            bottom=ft.BorderSide(4, ft.colors.with_opacity(0.5, ft.colors.ON_SURFACE))
        ),
        left_axis=ft.ChartAxis(
            labels=[
                ft.ChartAxisLabel(
                    value=1,
                    label=ft.Text("1m", size=14, weight=ft.FontWeight.BOLD),
                ),
                ft.ChartAxisLabel(
                    value=2,
                    label=ft.Text("2m", size=14, weight=ft.FontWeight.BOLD),
                ),
                ft.ChartAxisLabel(
                    value=3,
                    label=ft.Text("3m", size=14, weight=ft.FontWeight.BOLD),
                ),
                ft.ChartAxisLabel(
                    value=4,
                    label=ft.Text("4m", size=14, weight=ft.FontWeight.BOLD),
                ),
                ft.ChartAxisLabel(
                    value=5,
                    label=ft.Text("5m", size=14, weight=ft.FontWeight.BOLD),
                ),
                ft.ChartAxisLabel(
                    value=6,
                    label=ft.Text("6m", size=14, weight=ft.FontWeight.BOLD),
                ),
            ],
            labels_size=40,
        ),
        bottom_axis=ft.ChartAxis(
            labels=[
                ft.ChartAxisLabel(
                    value=2,
                    label=ft.Container(
                        ft.Text(
                            "SEP",
                            size=16,
                            weight=ft.FontWeight.BOLD,
                            color=ft.colors.with_opacity(0.5, ft.colors.ON_SURFACE),
                        ),
                        margin=ft.margin.only(top=10),
                    ),
                ),
                ft.ChartAxisLabel(
                    value=7,
                    label=ft.Container(
                        ft.Text(
                            "OCT",
                            size=16,
                            weight=ft.FontWeight.BOLD,
                            color=ft.colors.with_opacity(0.5, ft.colors.ON_SURFACE),
                        ),
                        margin=ft.margin.only(top=10),
                    ),
                ),
                ft.ChartAxisLabel(
                    value=12,
                    label=ft.Container(
                        ft.Text(
                            "DEC",
                            size=16,
                            weight=ft.FontWeight.BOLD,
                            color=ft.colors.with_opacity(0.5, ft.colors.ON_SURFACE),
                        ),
                        margin=ft.margin.only(top=10),
                    ),
                ),
            ],
            labels_size=32,
        ),
        tooltip_bgcolor=ft.colors.with_opacity(0.8, ft.colors.BLUE_GREY),
        min_y=0,
        max_y=4,
        min_x=0,
        max_x=14,
        # animate=5000,
        expand=True,
    )

    def toggle_data(e):
        if s.toggle:
            chart.data_series = data_2
            chart.data_series[2].point = True
            chart.max_y = 6
            chart.interactive = False
        else:
            chart.data_series = data_1
            chart.max_y = 4
            chart.interactive = True
        s.toggle = not s.toggle
        chart.update()

    page.add(ft.IconButton(ft.icons.REFRESH, on_click=toggle_data), chart)

ft.app(main)
LineChart 2

import flet as ft

class State:
    toggle = True

s = State()

def main(page: ft.Page):
    data_1 = [
        ft.LineChartData(
            data_points=[
                ft.LineChartDataPoint(0, 3),
                ft.LineChartDataPoint(2.6, 2),
                ft.LineChartDataPoint(4.9, 5),
                ft.LineChartDataPoint(6.8, 3.1),
                ft.LineChartDataPoint(8, 4),
                ft.LineChartDataPoint(9.5, 3),
                ft.LineChartDataPoint(11, 4),
            ],
            stroke_width=5,
            color=ft.colors.CYAN,
            curved=True,
            stroke_cap_round=True,
        )
    ]

    data_2 = [
        ft.LineChartData(
            data_points=[
                ft.LineChartDataPoint(0, 3.44),
                ft.LineChartDataPoint(2.6, 3.44),
                ft.LineChartDataPoint(4.9, 3.44),
                ft.LineChartDataPoint(6.8, 3.44),
                ft.LineChartDataPoint(8, 3.44),
                ft.LineChartDataPoint(9.5, 3.44),
                ft.LineChartDataPoint(11, 3.44),
            ],
            stroke_width=5,
            color=ft.colors.CYAN,
            curved=True,
            stroke_cap_round=True,
        )
    ]

    chart = ft.LineChart(
        data_series=data_1,
        border=ft.border.all(3, ft.colors.with_opacity(0.2, ft.colors.ON_SURFACE)),
        horizontal_grid_lines=ft.ChartGridLines(
            interval=1, color=ft.colors.with_opacity(0.2, ft.colors.ON_SURFACE), width=1
        ),
        vertical_grid_lines=ft.ChartGridLines(
            interval=1, color=ft.colors.with_opacity(0.2, ft.colors.ON_SURFACE), width=1
        ),
        left_axis=ft.ChartAxis(
            labels=[
                ft.ChartAxisLabel(
                    value=1,
                    label=ft.Text("10K", size=14, weight=ft.FontWeight.BOLD),
                ),
                ft.ChartAxisLabel(
                    value=3,
                    label=ft.Text("30K", size=14, weight=ft.FontWeight.BOLD),
                ),
                ft.ChartAxisLabel(
                    value=5,
                    label=ft.Text("50K", size=14, weight=ft.FontWeight.BOLD),
                ),
            ],
            labels_size=40,
        ),
        bottom_axis=ft.ChartAxis(
            labels=[
                ft.ChartAxisLabel(
                    value=2,
                    label=ft.Container(
                        ft.Text(
                            "MAR",
                            size=16,
                            weight=ft.FontWeight.BOLD,
                            color=ft.colors.with_opacity(0.5, ft.colors.ON_SURFACE),
                        ),
                        margin=ft.margin.only(top=10),
                    ),
                ),
                ft.ChartAxisLabel(
                    value=5,
                    label=ft.Container(
                        ft.Text(
                            "JUN",
                            size=16,
                            weight=ft.FontWeight.BOLD,
                            color=ft.colors.with_opacity(0.5, ft.colors.ON_SURFACE),
                        ),
                        margin=ft.margin.only(top=10),
                    ),
                ),
                ft.ChartAxisLabel(
                    value=8,
                    label=ft.Container(
                        ft.Text(
                            "SEP",
                            size=16,
                            weight=ft.FontWeight.BOLD,
                            color=ft.colors.with_opacity(0.5, ft.colors.ON_SURFACE),
                        ),
                        margin=ft.margin.only(top=10),
                    ),
                ),
            ],
            labels_size=32,
        ),
        tooltip_bgcolor=ft.colors.with_opacity(0.8, ft.colors.BLUE_GREY),
        min_y=0,
        max_y=6,
        min_x=0,
        max_x=11,
        # animate=5000,
        expand=True,
    )

    def toggle_data(e):
        if s.toggle:
            chart.data_series = data_2
            chart.interactive = False
        else:
            chart.data_series = data_1
            chart.interactive = True
        s.toggle = not s.toggle
        chart.update()

    page.add(ft.ElevatedButton("avg", on_click=toggle_data), chart)

ft.app(main)
LineChart properties

animate
Controls chart implicit animation.
The value of animate property could be one of the following types:
bool-Trueto enable chart animation withlinearcurve and1000milliseconds duration.int- enables chart animation withlinearcurve and specified number of milliseconds.ft.Animation(duration: int, curve: str)- enables chart animation with specified duration and transition curve.
If animate is None then linear animation with 150 milliseconds duration is enabled by default.
baseline_x
Baseline value for X axis. Default is 0.
baseline_y
Baseline value for Y axis. Default is 0.
bgcolor
Background color of the chart.
border
The border around the chart. The value is the instance of ft.Border class.
bottom_axis
Configures the appearance of the bottom axis, its title and labels. The value is the instance of ChartAxis class.
data_series
A list of LineChartData controls drawn as separate lines on a chart.
horizontal_grid_lines
Controls drawing of chart's horizontal lines. The value is the instance of ChartGridLines class.
interactive
Enables automatic tooltips and points highlighting when hovering over the chart.
left_axis
Configures the appearance of the left axis, its title and labels. The value is the instance of ChartAxis class.
max_x
Configures the maximum displayed value for X axis.
max_y
Configures the maximum displayed value for Y axis.
min_x
Configures the minimum displayed value for X axis.
min_y
Configures the minimum displayed value for Y axis.
point_line_end
The end of the vertical line drawn at selected point position. Default is data point's y value.
point_line_start
The start of the vertical line drawn under the selected point. Default is chart's bottom edge.
right_axis
Configures the appearance of the right axis, its title and labels. The value is the instance of ChartAxis class.
tooltip_bgcolor
Background color of tooltips.
top_axis
Configures the appearance of the top axis, its title and labels. The value is the instance of ChartAxis class.
vertical_grid_lines
Controls drawing of chart's vertical lines. The value is the instance of ChartGridLines class.
LineChart events
on_chart_event
Fires when a chart line is hovered or clicked.
Event data is an instance ft.LineChartEvent class with the following properties:
typeevent type such asPointerHoverEvent,PointerExitEvent, etc.bar_index- line's index or-1if no line hovered.spot_index- line point's index or-1if no point hovered.
LineChartData properties
above_line
A vertical line drawn between a line point and the top edge of the chart. The value is an instance of ChartPointLine class.
above_line_bgcolor
Fill the area above chart line with the specified color.
above_line_cutoff_y
Cut off filled area above line chart at specific Y value.
above_line_gradient
Fill the area above chart line with the specified gradient.
below_line
A vertical line drawn between a line point and the bottom edge of the chart. The value is an instance of ChartPointLine class.
below_line_bgcolor
Fill the area below chart line with the specified color.
below_line_cutoff_y
Cut off filled area below line chart at specific Y value.
below_line_gradient
Fill the area below chart line with the specified gradient.
color
A color of chart line.
curved
Set to True to draw chart line as a curve. Default is False.
dash_pattern
Defines dash effect of the line. The value is a circular list of dash offsets and lengths. For example, the list [5, 10] would result in dashes 5 pixels long followed by blank spaces 10 pixels long. By default, a solid line is drawn.
data_points
A list of points (dots) of LineChartDataPoint type representing a single chart line.
gradient
Gradient to draw line's background. See Container.gradient property for more information and possible values.
point
Configures the appearance and shape of a line point (dot). The value of this property is either True - draw a point with default style, False - do not draw a line point, or one of the implementations of ChartPointShape class:
ChartCirclePoint- circle pointChartSquarePoint- square pointChartCrossPoint- cross point
prevent_curve_over_shooting
Whether to prevent overshooting when draw curve line on linear sequence spots. Defaults to False.
prevent_curve_over_shooting_threshold
Threshold for applying prevent overshooting algorithm. Defaults to 10.0.
shadow
Shadow to drop by a chart line. The value is the instance of ft.Shadow class.
selected_below_line
A vertical line drawn between selected line point and the bottom adge of the chart. The value is either True - draw a line with default style, False - do not draw a line under selected point, or an instance of ChartPointLine class to specify line style to draw.
selected_point
Configures the appearance and shape of a selected line point. See LineChartData.point for supported property values.
stroke_cap_round
Set to True to draw rounded line caps. Default is False.
stroke_width
The width of a chart line.
LineChartDataPoint properties
point
Configures the appearance and shape of a line point. See LineChartData.point for supported property values.
selected
Draw the point as selected when LineChart.interactive is set to False.
selected_below_line
A vertical line drawn between selected line point and the bottom adge of the chart. The value is either True - draw a line with default style, False - do not draw a line under selected point, or an instance of ChartPointLine class to specify line style to draw.
selected_point
Configures the appearance and shape of a selected line point. See LineChartData.point for supported property values.
show_above_line
True to display a line above data point. Default is True.
show_below_line
True to display a line below data point. Default is True.
show_tooltip
True (default) if a tooltip should be shown on top of hovered data point.
tooltip
A custom tooltip value. Default is y.
tooltip_align
An align for the tooltip. The value is the instance of ft.TextAlign enum.
tooltip_style
A text style to display tooltip with. The value is the instance of ft.TextStyle class.
x
The position of a point on X axis.
y
The position of a point on Y axis.
ChartGridLines properties
Configures the appearance of horizontal and vertical grid lines within the chart.
color
Color of a grid line.
dash_pattern
Defines dash effect of the line. The value is a circular list of dash offsets and lengths. For example, the list [5, 10] would result in dashes 5 pixels long followed by blank spaces 10 pixels long. By default, a solid line is drawn.
interval
Interval between grid lines. Default is 1.
width
Width of a grid line. Default is 1.
ChartAxis properties
Configures chart axis.
labels
The list of ft.ChartAxisLabel objects to set custom axis labels for only specific values.
labels_interval
The interval between automatic labels.
labels_size
Width or height of labels area.
show_labels
True to display labels along the axis. If labels is empty then automatic labels are displayed.
title
A Control to display as axis title.
title_size
Width or height of title area.
ChartAxisLabel properties
Configures a custom label for specific value.
label
A Control to draw as a label.
value
A value to draw label for.
ChartPointLine properties
color
Color of the line.
dash_pattern
Dash pattern of the line.
width
Width of the line.