PieChart
Draws a pie chart.
Examples
PieChart 1

import flet as ft

def main(page: ft.Page):
    normal_border = ft.BorderSide(0, ft.colors.with_opacity(0, ft.colors.WHITE))
    hovered_border = ft.BorderSide(6, ft.colors.WHITE)

    def on_chart_event(e: ft.PieChartEvent):
        for idx, section in enumerate(chart.sections):
            section.border_side = (
                hovered_border if idx == e.section_index else normal_border
            )
        chart.update()

    chart = ft.PieChart(
        sections=[
            ft.PieChartSection(
                25,
                color=ft.colors.BLUE,
                radius=80,
                border_side=normal_border,
            ),
            ft.PieChartSection(
                25,
                color=ft.colors.YELLOW,
                radius=65,
                border_side=normal_border,
            ),
            ft.PieChartSection(
                25,
                color=ft.colors.PINK,
                radius=60,
                border_side=normal_border,
            ),
            ft.PieChartSection(
                25,
                color=ft.colors.GREEN,
                radius=70,
                border_side=normal_border,
            ),
        ],
        sections_space=1,
        center_space_radius=0,
        on_chart_event=on_chart_event,
        expand=True,
    )

    page.add(chart)

ft.app(main)
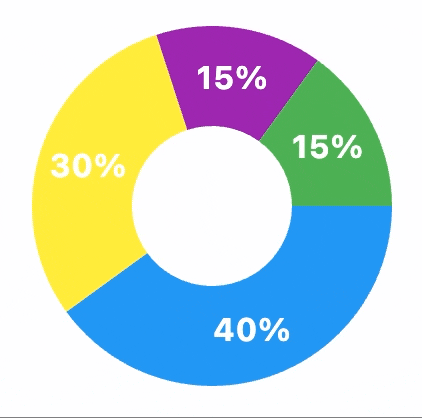
PieChart 2
import flet as ft

def main(page: ft.Page):
    normal_radius = 50
    hover_radius = 60
    normal_title_style = ft.TextStyle(
        size=16, color=ft.colors.WHITE, weight=ft.FontWeight.BOLD
    )
    hover_title_style = ft.TextStyle(
        size=22,
        color=ft.colors.WHITE,
        weight=ft.FontWeight.BOLD,
        shadow=ft.BoxShadow(blur_radius=2, color=ft.colors.BLACK54),
    )

    def on_chart_event(e: ft.PieChartEvent):
        for idx, section in enumerate(chart.sections):
            if idx == e.section_index:
                section.radius = hover_radius
                section.title_style = hover_title_style
            else:
                section.radius = normal_radius
                section.title_style = normal_title_style
        chart.update()

    chart = ft.PieChart(
        sections=[
            ft.PieChartSection(
                40,
                title="40%",
                title_style=normal_title_style,
                color=ft.colors.BLUE,
                radius=normal_radius,
            ),
            ft.PieChartSection(
                30,
                title="30%",
                title_style=normal_title_style,
                color=ft.colors.YELLOW,
                radius=normal_radius,
            ),
            ft.PieChartSection(
                15,
                title="15%",
                title_style=normal_title_style,
                color=ft.colors.PURPLE,
                radius=normal_radius,
            ),
            ft.PieChartSection(
                15,
                title="15%",
                title_style=normal_title_style,
                color=ft.colors.GREEN,
                radius=normal_radius,
            ),
        ],
        sections_space=0,
        center_space_radius=40,
        on_chart_event=on_chart_event,
        expand=True,
    )

    page.add(chart)

ft.app(main)
PieChart 3
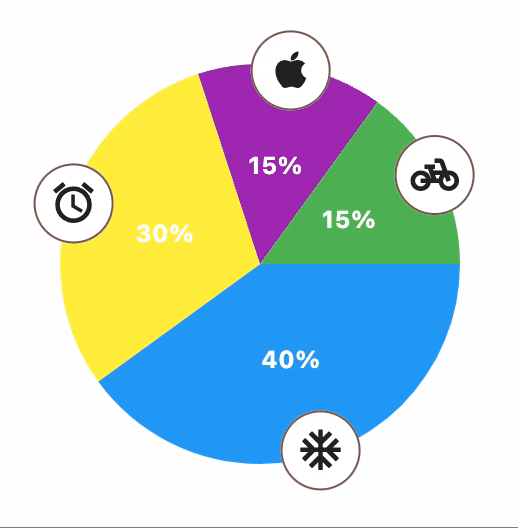
import flet as ft

def main(page: ft.Page):
    normal_radius = 100
    hover_radius = 110
    normal_title_style = ft.TextStyle(
        size=12, color=ft.colors.WHITE, weight=ft.FontWeight.BOLD
    )
    hover_title_style = ft.TextStyle(
        size=16,
        color=ft.colors.WHITE,
        weight=ft.FontWeight.BOLD,
        shadow=ft.BoxShadow(blur_radius=2, color=ft.colors.BLACK54),
    )
    normal_badge_size = 40
    hover_badge_size = 50

    def badge(icon, size):
        return ft.Container(
            ft.Icon(icon),
            width=size,
            height=size,
            border=ft.border.all(1, ft.colors.BROWN),
            border_radius=size / 2,
            bgcolor=ft.colors.WHITE,
        )

    def on_chart_event(e: ft.PieChartEvent):
        for idx, section in enumerate(chart.sections):
            if idx == e.section_index:
                section.radius = hover_radius
                section.title_style = hover_title_style
            else:
                section.radius = normal_radius
                section.title_style = normal_title_style
        chart.update()

    chart = ft.PieChart(
        sections=[
            ft.PieChartSection(
                40,
                title="40%",
                title_style=normal_title_style,
                color=ft.colors.BLUE,
                radius=normal_radius,
                badge=badge(ft.icons.AC_UNIT, normal_badge_size),
                badge_position=0.98,
            ),
            ft.PieChartSection(
                30,
                title="30%",
                title_style=normal_title_style,
                color=ft.colors.YELLOW,
                radius=normal_radius,
                badge=badge(ft.icons.ACCESS_ALARM, normal_badge_size),
                badge_position=0.98,
            ),
            ft.PieChartSection(
                15,
                title="15%",
                title_style=normal_title_style,
                color=ft.colors.PURPLE,
                radius=normal_radius,
                badge=badge(ft.icons.APPLE, normal_badge_size),
                badge_position=0.98,
            ),
            ft.PieChartSection(
                15,
                title="15%",
                title_style=normal_title_style,
                color=ft.colors.GREEN,
                radius=normal_radius,
                badge=badge(ft.icons.PEDAL_BIKE, normal_badge_size),
                badge_position=0.98,
            ),
        ],
        sections_space=0,
        center_space_radius=0,
        on_chart_event=on_chart_event,
        expand=True,
    )

    page.add(chart)

ft.app(main)
PieChart properties

animate
Controls chart implicit animation. See LineChart.animate property for more information and possible values.
center_space_color
Free space color in the middle of a chart.
center_space_radius
Free space radius in the middle of a chart.
sections_space
A gap between sections.
start_degree_offset
By default, sections are drawn from zero degree (right side of the circle) clockwise.
You can change the starting point, by setting start_degree_offset (in degrees).
sections
A list of PieChartSection controls drawn in a circle.
PieChart events
on_chart_event
Fires when a chart section is hovered or clicked.
Event data is an instance ft.PieChartEvent class with the following properties:
typeevent type such asPointerHoverEvent,PointerExitEvent, etc.section_index- section's index or-1if no section hovered.
PieChartSection properties
value
Determines how much the section should occupy. This depends on sum of all sections, each section should occupy (value / sumValues) * 360 degrees.
radius
External radius of the section.
color
Background color of the section.
border_side
The border around section shape. The value is an instance of ft.BorderSide class.
title
A title drawn at the center of the section. No title is drawn if title is empty.
title_style
The style to draw title with. The value is an instance of ft.TextStyle ft.TextStyle class.
title_position
By default title is drawn in the middle of the section, but its position can be changed
with title_position property which value must be between 0.0 and 1.0:
0.0means near the center;1.0means near the outside of the pie chart.
badge
An optional Control drawn in the middle of a section.
badge_position
By default the badge is drawn in the middle of the section, but its position can be changed with badge_position property which value must be between 0.0 and 1.0:
0.0means near the center;1.0means near the outside of the pie chart.